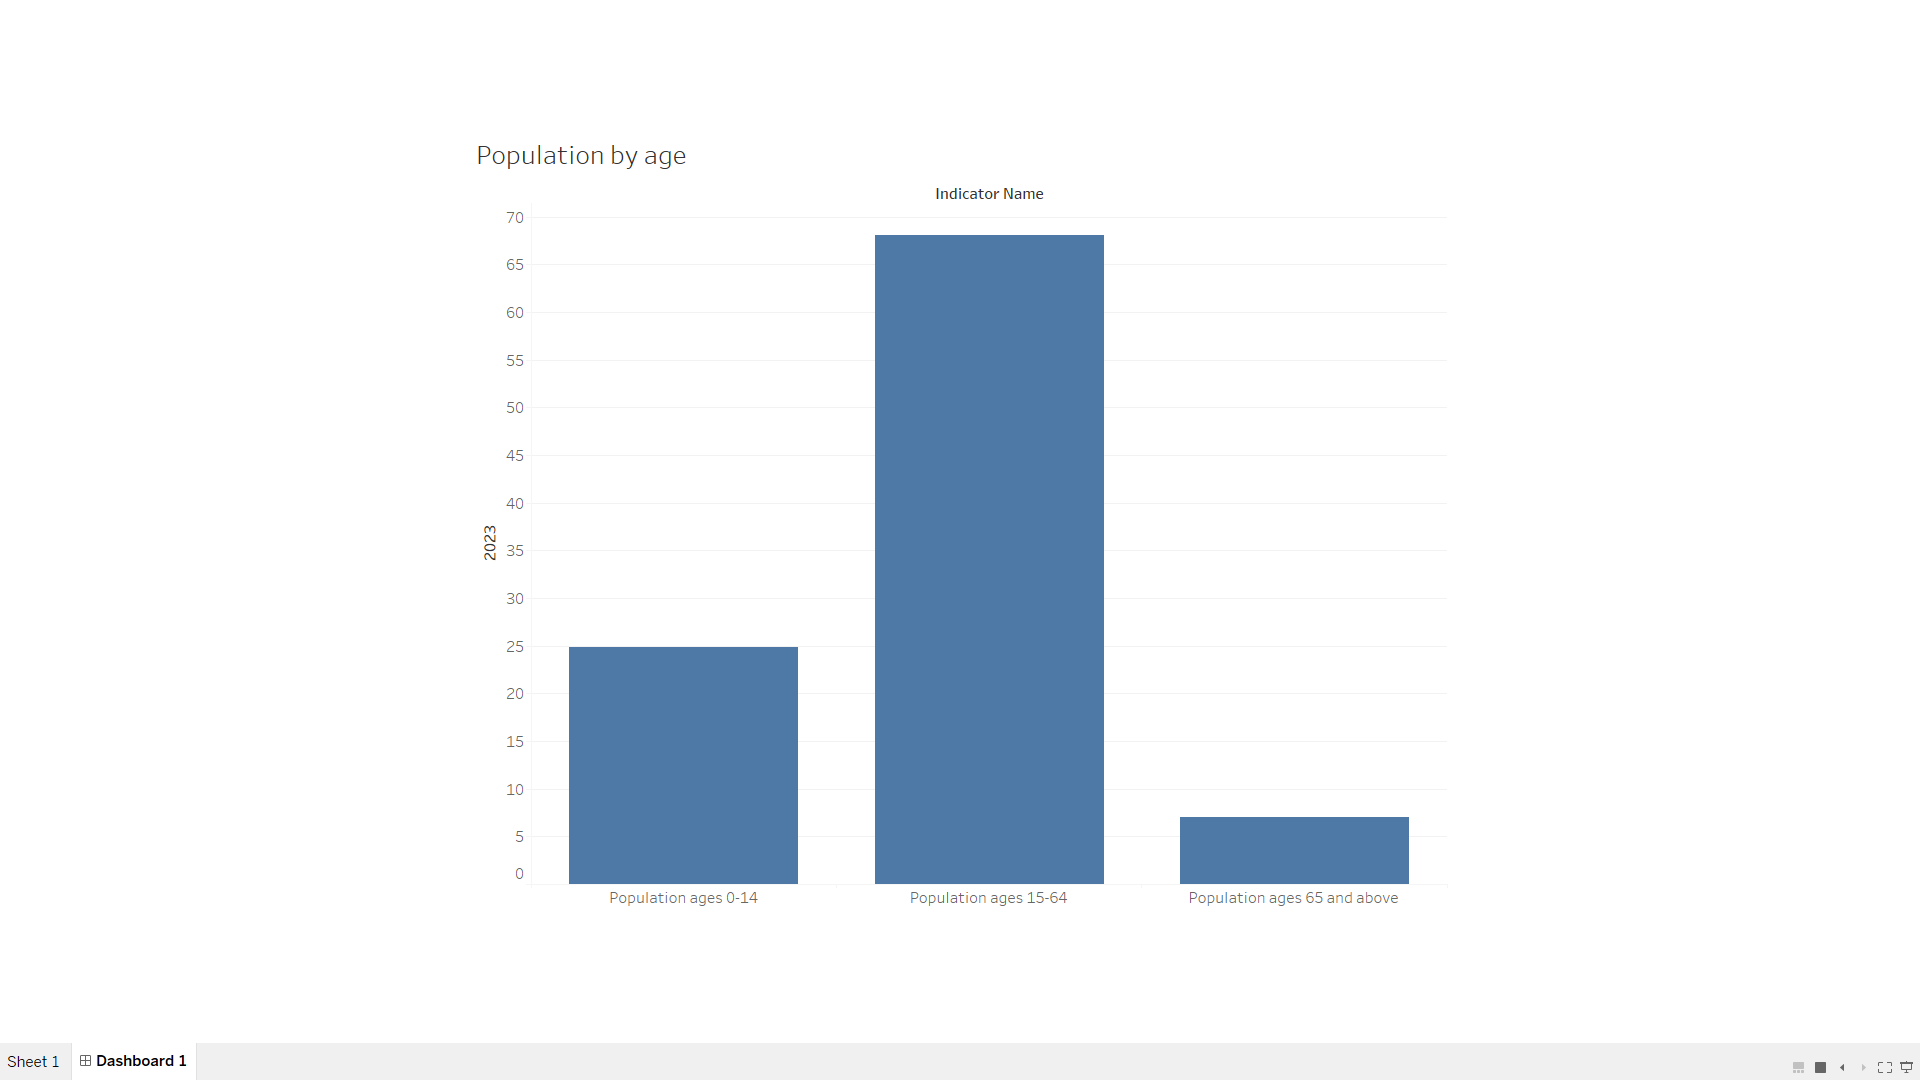
Create a bar chart or histogram to visualize the distribution of a categorical or continuous variable, such as the distribution of ages or genders in a population. As part of my first task for my online internship at SkillCraft Technology, I was assigned to create a bar chart or histogram using tools like Python, Tableau, or Power BI. To begin, I gathered population data from India, focusing on key variables such as age and gender. After collecting the data, I performed a thorough data cleaning process, which involved removing duplicates and addressing any missing values to ensure the dataset was accurate and ready for analysis. For this project, I opted to use a bar chart to visualize the distribution of the categorical variable, age, providing a clear view of how different age groups are represented within the population.
The result of the Barchart as below: